
What Is a Second Use Worth?
A new page on the Exaptation AI website shows the lifetime revenue of five businesses that grew from an exaptation, and a calculator lets you model one on your own numbers. This post explains the sources and methods behind both.
By Shripal Shah, DBA, Founder, Exaptation AI
For new readers: in biology, an exaptation is a trait that evolved for one purpose and later took on a different one. In business, it is the moment an existing asset or resource starts doing a valuable job it was never designed to do.
The question we hear most often is a simple one: what is a second use actually worth? Case stories show that exaptations happen. They do not show how much money they make, how long it takes, or how much of the result belongs to the original discovery rather than everything that came after it.
The new page answers in two parts. First, a table shows the lifetime revenue of five businesses that began as a new use for something that already existed, and the share of that revenue we credit to the original discovery. Second, a calculator lets you model a second business line on your own company in a few minutes.
Both are free. The calculator runs entirely in your browser, so nothing you type is saved or sent anywhere. This post is for readers who want to check our work before they trust it: analysts, scholars, operators, and investors.
What the Table Shows
Each row is one business that grew from a second use of an existing resource: Google Search, Nvidia's data center business, Viagra, Uber Eats, and Replit's AI agent. For each one, the table shows the year the second use began, its revenue over the years shown, the share we credit to the original exaptation, and that credit in dollars.
The credit buttons let you switch between a low, central, and high estimate. We show a range rather than one number on purpose. Crediting an original discovery is a judgment, and we would rather show you the range of reasonable judgments than hide it behind a single figure.
We chose these five because each one passed three filters. The case has cleared our review as an exaptation. The second use earns money for the company itself. And its revenue can be separated out and sourced, from company reports or, for Replit, figures reported in the press.
Several well-known cases did not make this first version. 3M does not report Post-it revenue separately. SpaceX is private. CoreWeave's second use is financial, so revenue is the wrong measure. Most of the value from Raytheon's magnetron went to the microwave oven industry rather than to Raytheon. We will add cases as reliable figures become available.
Which Years We Count, and Why
We count revenue over a stretch of years, not a single year, because a second use builds value over time. One year is a snapshot. A decade or more shows what the second use actually became.
There is a limit to how far back we can go. Companies only report a new business separately once it is large enough to matter, so the early years are often folded into other lines. We count only the years each company reported, which makes every total a floor rather than a ceiling.
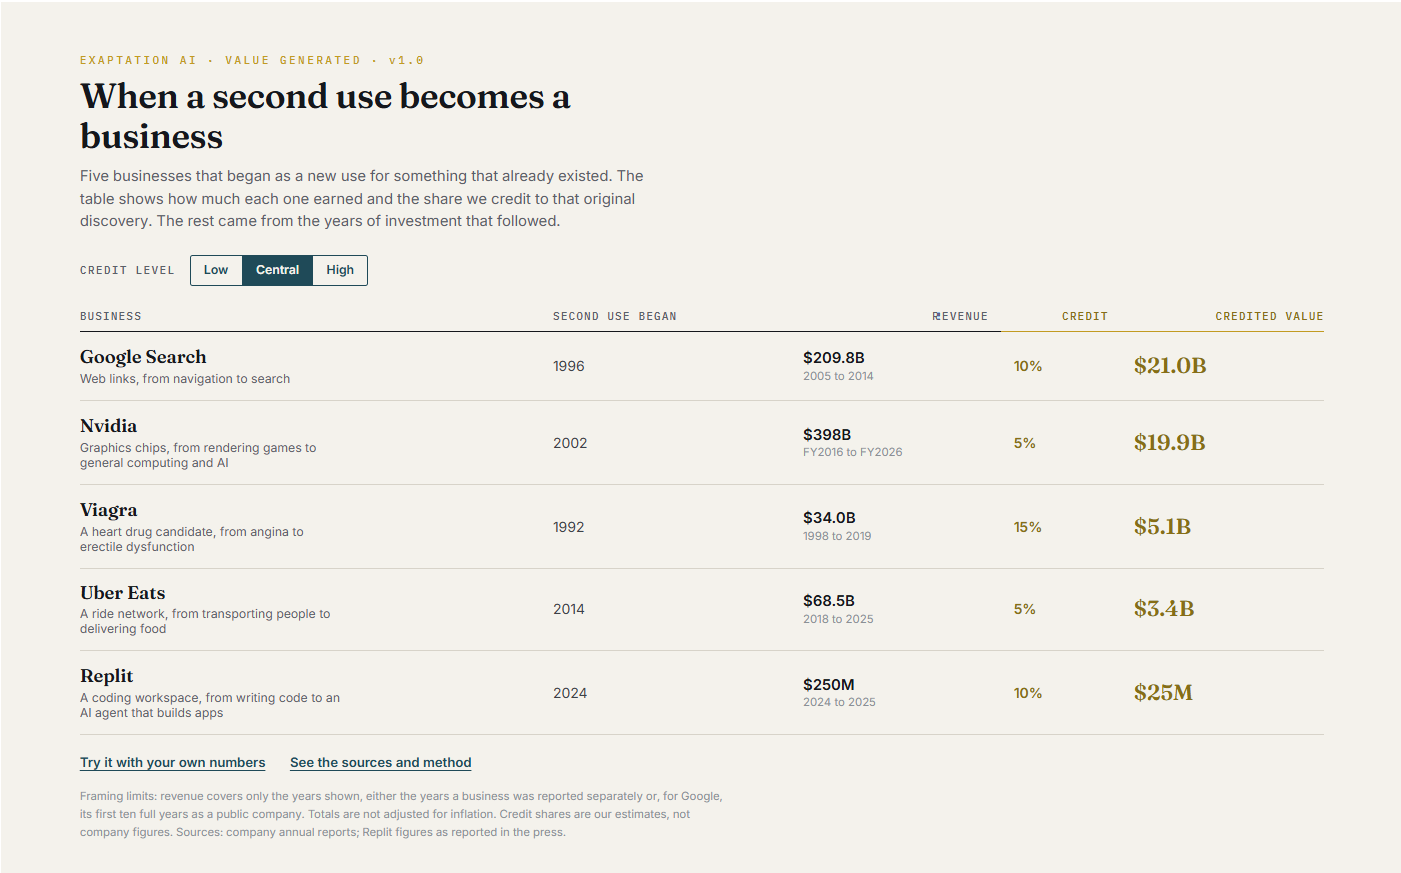
For Google, we count 2005 to 2014 on purpose. The advertising model was in place, and the August 2004 IPO had made Google a public company with reported financials, so these are its first ten full years as one. A decade is the kind of period a financial analyst would model. Later years carry more of the weight of everything Google built after search, including YouTube, Android, Chrome, and cloud.
For the other cases, we count every reported year. Viagra's 1998 to 2019 run roughly matches the 20-year life of a drug patent. Uber Eats and Replit are young enough that every year they have reported is still an early year.
Analysts usually project a business about 10 years out and then fold everything after that into a single terminal value. Our table is not a projection. It adds up revenue that already happened, so a terminal value does not apply. We still lean on the 10-year habit for one reason: the further a business travels from its origin, the less of its revenue the origin can explain.*
Why We Never Credit 100%
It is tempting to say that a second business belongs entirely to the exaptation that started it. After all, it would not exist without it. In our Google Search case we warned against exactly this: we should be cautious not to attribute all of Google's success to the original search innovation. That would create an attribution error.
"It would not have happened without it" is a necessary condition, not a share of the value. Uber Eats needed Uber's ride network to start, but it also needed eleven years of courier incentives, a $2.65 billion acquisition of Postmates, a grocery business, and an advertising business. Crediting all of today's revenue to a 2014 test in Los Angeles ignores everything that came after.
Finance and the courts already deal with this problem, and we borrowed their tools:
• Patent damages. U.S. courts allow damages based on a whole product's value only when the patented feature is the reason customers buy it. Otherwise the value must be split, or apportioned, among everything that contributed.
• Licensing deals. A royalty is the market price of one contributing asset's share. Most patent licenses settle between 1% and 10% of sales. In one large study of pharmaceutical licenses, the median was 5%.
• The 25% rule. An old rule of thumb gave a technology owner about a quarter of the profit it helped create. Courts rejected it as a rule in 2011, but studies still find real royalties land near it. We use it only as a sanity check.
• Acquisition accounting. When a buyer values an acquired technology or brand, it first subtracts a fair return on every other asset that helped earn the cash, such as equipment, staff, and brand. Only what remains belongs to the asset being valued.
None of these hands us a single percentage for exaptations. Together, they show how analysts think: give the original idea credit for the part it actually drove, after paying back everything else that went in.
How We Set Each Credit Range
We score each case on three questions drawn from those tools. The more questions a case passes, the higher its credit.
1. Demand. Is the second use itself the reason customers buy? Viagra passes clearly: the drug's effect is the product. Uber Eats passes only partly: people order on selection, speed, and price, not because Uber's drivers once carried passengers.
2. Replication. Could a well-funded rival reach the same business without the original asset? DoorDash, a standalone company founded in 2013, built a delivery business as large as Uber Eats with no ride network behind it. That tells us Uber's real edge was a head start and shared costs, not the whole business.
3. Later investment and time. How much capital, acquisition, and effort came after the discovery, and how many years have passed? Credit fades as later investment piles up.*
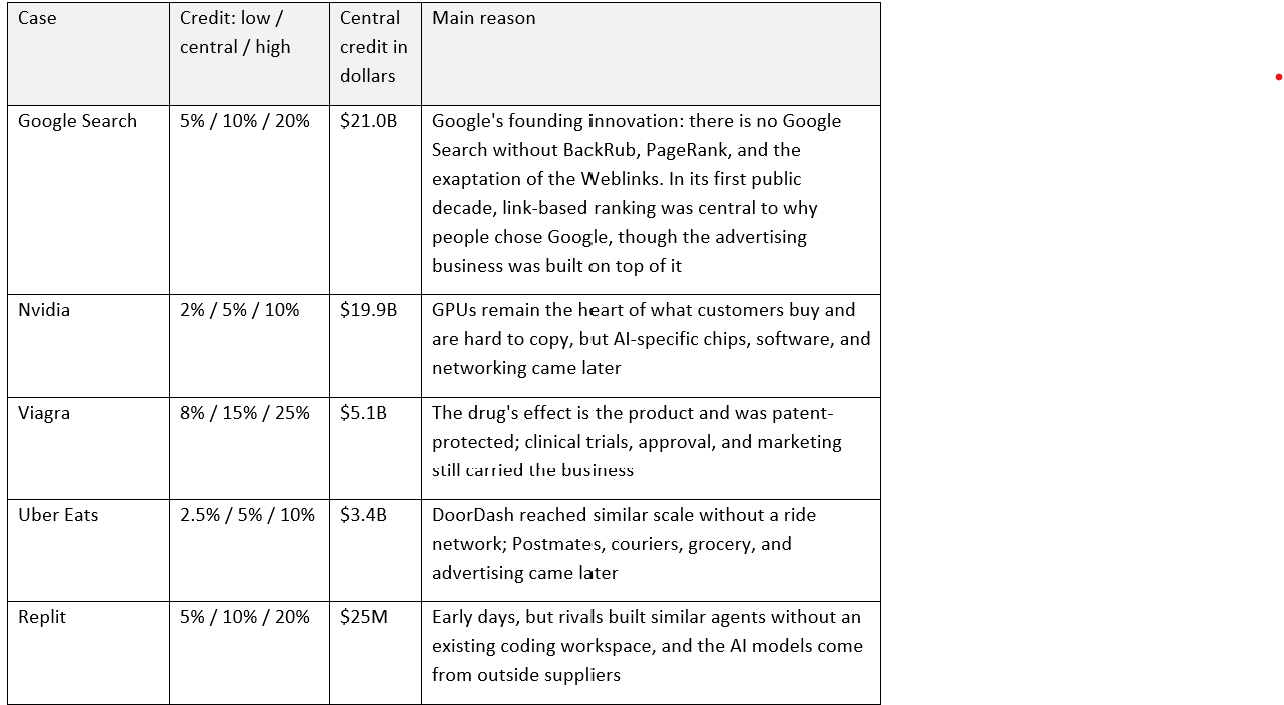
ExaptationAI method for applying specific credit to each historical exaptation case in large companies.
Two checks keep the ranges honest. Most central figures sit inside the 1% to 10% band where real licenses settle. Google and Viagra sit at the top of that band or above it, because in both cases the second use was the reason customers chose the product.* Google's founding decade is our most generous call, and it may sit above the 25% profit check. We accept that, because the check is a guide, not a ceiling.
How the Calculator Works
The calculator compares what your company is worth today with what it could be worth if you add a second business line built on assets you already own. Rough numbers are fine. The point is to see which assumptions move the answer.
You enter two sets of numbers:
• Your core business: revenue, growth, cash margin, your discount rate, and long-term growth after year 10.
• The new business line: how many customers have the problem it solves, what solving it is worth to each one, the share of that value you charge, the share of customers you win at peak, when revenue starts and how fast it ramps, its margin, any core sales it pulls away, what it would cost to build from scratch, how much of that your existing assets cover, what those assets would earn in their next best use, and its chance of success.
The core business is valued on ten years of cash flow plus a terminal value for the years after, all discounted to today. The new line's revenue follows one line of arithmetic:
\text{Peak revenue} = \text{customers} \times \text{share won} \times \text{value per customer} \times \text{share charged}
If the new line fails, you lose the build cost and earn nothing from it. If it works, you earn its full value. The calculator weights the two outcomes by your chance of success:
\text{Value added} = \text{chance of success} \times \text{PV(new line's cash flows)} - \text{PV(build cost)}
From there it reports the company's value with the new line, peak revenue, payback year, return on new cash, and one number we find especially useful: the chance of success needed to break even. If you believe the odds are better than that, the new line is worth a closer look.
\text{Break-even chance} = \frac{\text{PV(build cost)}}{\text{PV(new line's cash flows)}}
Two views show sensitivity. "Which assumptions matter most" moves each input down and up and ranks them by how much the result changes. "Explore one assumption" shows the result across a range of values for any input you pick.
A few choices deserve a word. The example sets the chance of success at 40% on purpose; a well-known study put the failure rate of launched products near 40%, and a second line is judged earlier than launch, so we start cautious.* The extra discount rate for the new line starts at zero, because using both a chance of success and a higher discount rate counts the same risk twice. And the result already subtracts the build cost, lost core sales, and the cost of tying up your assets, so we do not apply a second credit percentage on top.
Everything runs in your browser. Nothing you enter is saved or sent anywhere.
What These Numbers Are Not
They are not company figures for the value of an exaptation. No company reports that. The revenue comes from company filings; the credit shares are our estimates, and reasonable people will set them differently. That is why we show a range.
They are not complete. Each total counts only the years the company reported the business separately. Google's figure includes YouTube and other Google-owned sites, because Google did not report search on its own until early 2020, when it broke out figures back to 2017. Nvidia's covers its whole Data Center segment, including networking.
They are not adjusted for inflation or discounted to today. A dollar of Viagra revenue in 1999 and a dollar of Nvidia revenue in 2025 are added at face value.
The calculator is not investment advice. It is a simplified version of a full ten-year model with three financial statements, staged risk, and up to three markets. Use it to see the shape of an opportunity and which assumptions matter, then test the assumptions that matter most.
Finally, these five cases are winners, chosen because they succeeded and reported their results. Most attempts to build a second business never reach this scale. The calculator's chance-of-success input exists for exactly that reason.
Try It With Your Own Numbers
The table shows that a fair share of a second use, even a small one, can be worth billions, and that it usually takes years to arrive. The calculator lets you ask the same question of your own company in a few minutes. If the answer is interesting, see our Services or book a time to find your exaptation.
At Exaptation AI, we are building the search engine for every asset's undiscovered functions. Growth, in our view, is a search problem.
Claims marked with an asterisk (*) are working interpretations we are actively testing against our case library, not settled findings.
Sources
Google Search
• Google Inc. (2007). Form 10-K, fiscal 2006. Google websites revenue, 2004 to 2006.
• Google Inc. (2010). Form 10-K, fiscal 2009. Google websites revenue, 2007 to 2009.
• Google Inc. (2013). Form 10-K, fiscal 2012, revenues by source. Google websites revenue, 2010 to 2012.
• Alphabet Inc. (2016). Form 10-K, fiscal 2015. Google websites revenue, 2013 and 2014, and what the line includes.
• Shah, S. (2026). Google Search: A $1 Trillion Exaptation. Exaptation AI blog.
Nvidia
• NVIDIA (2018). Form 10-K, fiscal 2018. Datacenter growth rates, fiscal 2016 to 2018.
• NVIDIA (2026). Financial results for fourth quarter and fiscal 2026. Data Center revenue, fiscal 2026.
• Shah, S. (2026). Found Fast, Selected Slow: The Substrate Behind Nvidia's Two Exaptations. Exaptation AI blog.
Uber Eats
• Uber Technologies (2021, 2022, 2023, 2024, 2026). Form 10-K for fiscal 2020, 2021, 2022, 2023, and 2025. Delivery segment revenue, 2018 to 2025.
• Axios (2020, July 6). Uber to buy Postmates in $2.65 billion deal.
Viagra
• Pfizer (2013). Form 10-K, fiscal 2012.
• Pfizer (2018). Form 10-K, fiscal 2017, significant product revenues. Viagra revenue, 2015 to 2017.
• Indianapolis Business Journal (2013). Pfizer, Teva reach deal to allow generic Viagra. Viagra revenue, 1998, 1999, and 2012.
Replit
• TechCrunch (2026, March 11). Replit snags $9B valuation six months after hitting $3B.
Credit and valuation methods
• Mondaq (2011). The Federal Circuit rejects the 25 percent rule and reviews the entire market value rule. On Uniloc v. Microsoft.
• RoyaltyRange. Royalty rates in the pharmaceutical industry.
• JD Supra. How much is your invention worth? On the 25% rule and a 2012 KPMG study.
• Castellion, G., & Markham, S. K. (2013). Perspective: New product failure rates. Journal of Product Innovation Management, 30(5).
• Shah, S. (2024). Exaptation Growth Strategy. Doctor of Business Administration dissertation, Pepperdine Graziadio Business School.